Why bends
Plants move solids through pipes every day: ore and sand in mining, sludge in wastewater plants, catalyst powders in chemical reactors, pulp, grain and food. The bends are where trouble starts.
At a bend, fast water is thrown against the outer wall and wears it away, while slow water on the inner side lets particles settle. The turn also sets the water swirling sideways in two vortices, called Dean vortices, which decide where the particles go. We chose a bend to study them.
Cross-section, 1 D after the bendLooking down the pipe, outer wall at the top. The lines follow the sideways flow: two counter-rotating swirls.
- Mining slurries
- Wastewater
- Chemical reactors
- Pulp and paper
- Food and grain
The thesis run at t = 2.00 s, cut open along the pipe’s mid-plane: blue is slow, red is fast. Drawn to scale from the dataset.
Problem
To see inside a pipe like this, engineers use computational fluid dynamics (CFD). The software splits the pipe into a mesh of tiny cells and solves the equations of fluid motion in every one, in small steps through time.
It is accurate, but slow, and every change to the setup means running it again. In the semester before this thesis I ran these simulations in OpenFOAM and waited on them. This thesis asks whether a model trained on the first part of a run can predict the rest, faster than the solver.
less compute time for the trained model than for the solver
saved time steps, every 0.05 s from 0 to 2 s
rows in each saved step, one per mesh point
sample planes, one before the bend and three after it
Case
A 40 mm pipe with a 90° bend, set up from OpenFOAM’s bentPipe example. Water enters at 0.5 m/s, about walking pace, carrying solid particles that make up 0.1% of its volume. It runs 10 diameters, turns upward and runs 10 more.
- Solver
- multiphaseEulerFoam, OpenFOAM 10
- Phases
- Water and particles, each treated as a fluid that fills the pipe (Euler–Euler)
- Pipe
- 40 mm diameter, 60 mm bend radius (1.5 D), 10 D straight on each side
- Inlet
- Water at 0.5 m/s, particles at 0.1% by volume
- Outlet
- 1 bar
- Walls
- Water sticks to the wall, particles slide along it. Turbulence near the wall uses the k-ε model.
- Density ratio
- 1.4: particles are 40% heavier than the same volume of water
- Temperature
- Constant (isothermal)
- Reynolds number
- About 20,000: turbulent, full of small eddies
Drawn to scale from the mesh. Hover a sample plane to find it in the drawing.
Particles
The particles are split into 30 size classes from 1 to 250 µm, spaced evenly on a log scale. The solver tracks how much particle volume sits in each class as particles collide, stick together and break apart.
Circle sizes follow the log scale, not true size: the largest class is 250 times the width of the smallest. Shares are of the particle volume at the inlet, from the size distribution below.
Physics
The solver doesn’t follow each grain. It treats the particles as a second fluid mixed through the water, with its own speed at every point. Four forces pass momentum between the two.
Drag uses the Wen–Yu model and lift the Saffman–Mei model. Gravity also acts: the particles are 1.4 times as dense as water.
The equationsOptional
Mass. Nothing appears or disappears. For each phase φ: volume fraction α, density ρ, velocity u.
Momentum. Newton’s second law for a fluid: stress τ, pressure p, gravity g, exchange M with the other phase, source S.
Exchange. The four forces above: drag, lift, turbulent dispersion and virtual mass.
Sticking and breaking
On the way through the pipe, particles bump into each other. Some stick and grow (aggregation). Strong eddies tear others apart (breakage). The solver tracks both, moving particle volume between the size classes.
How often each happens depends on particle size and on how turbulent the water is. The two charts show the rules the solver uses.
The equationsOptional
Population balance. Counts particles of each volume v as they move, stick and break. Sv holds aggregation and breakage.
Aggregation. Adachi et al. (1994). ε: how fast turbulence burns energy, ν: kinematic viscosity.
Breakage. Kusters (1991). εcr = B / rc, from particle strength B and collision radius rc.
Sticking rate for every pair of sizes
Hover a cell.
Breaking rate against turbulence
Hover the curve.
Left: darker means two particles of those sizes stick more often, relative to two 1 µm particles. Large pairs stick millions of times more often. Right: below a critical turbulence level (εcr) particles barely break; above it, breakage climbs toward its limit.
Size distribution
Read it like a histogram: the higher a curve, the more particle volume sits at that size. At the inlet the peak is around 25 µm. One diameter after the bend it has moved to about 55 µm, and by nine diameters it is near 66 µm, as particles stick together on the way up the pipe.
Fig. 4.1 from the thesis, digitised: the volumetric density in each of the 30 classes at one time step.
Simulation
What the 41 saved steps show, read straight from the dataset.
Flow
Blue is slow and red is fast. The water starts at 0.5 m/s everywhere. Water touching a wall can’t move, so over the first second a slow layer grows from the walls, and the bend throws the fastest water toward its outer wall. From about 1.4 s on, the field barely changes.
Below, the pipe’s mid-plane is straightened out with the inlet on the left, and the four sample planes sit under it. Arrows on the planes show the sideways flow.
|U| on the x = 0 plane and on the four sample planes at all 41 saved times. The strip is stretched four times across the pipe so the walls stay readable. Hover anywhere for the value.
Dean vortices
This swirl is why we picked a bend. In the bend, the fast water in the middle of the pipe is flung toward the outer wall, the way you lean outward in a turning car. The slow water near the walls can’t keep up, so it is pushed back around the sides toward the inner wall. The result is two counter-rotating swirls, named after W. R. Dean, who described them in 1927.
A stirred cup of tea does the same thing: the leaves gather in the middle of the bottom because a sideways circulation sweeps them there.
peak sideways flow, inside the bend: half the speed the water enters with
Dean number. Above about 100 the swirls are strong; this flow is far past that.
still swirling ten diameters after the bend: a tenth of the inlet speed
Hover the chart.
Every mesh section along the pipe at t = 2.00 s. The swirl starts inside the bend, peaks just before its exit and fades slowly up the vertical leg. The coloured ticks are the thesis sample planes.
Profiles
Speed across the pipe, from the bend’s inner wall to its outer wall. Before the bend the profile is flat and symmetric. One diameter after it, the outer half runs at about 0.61 m/s while the inner half drops to about 0.33 m/s.
On the bend plane (x = 0) of each sample plane. The time control is shared with the flow figure above.
Model
From 41 CSV files to two XGBoost models.
How it works
From the solver’s output to a prediction, in six steps. Every number in this walkthrough comes from the thesis run.
Simulate
OpenFOAM solves the flow and saves a snapshot every 0.05 s: 41 from 0 to 2 s. Here is one cross-section, one diameter after the bend, in 14 of them. Watch the slow region grow.
Export
ParaView exports each snapshot as a table, one row per mesh point: where it is, and the water’s velocity and pressure there. Five of this plane’s points are picked out.
Follow a point
Line the 41 tables up by point ID, and every point gets a history: how its velocity changed over the run. This is one point, 7 mm off the centre line.
Build rows
Slide along the history. At each step, the point’s last three values of Ux and its current Uy and Uz are the inputs, and its current Ux is the answer to learn. Every point at every step gives one row.
Train
Rows from the first 1.5 s train XGBoost, which learns how the inputs map to the answer one small decision tree at a time. One model is trained for each velocity component.
Predict
For the steps after 1.5 s the model predicts the velocity at every point. Its fields are then drawn next to the solver’s to see how close they come.
Dataset
I exported the run from ParaView as one CSV per saved time step: 41 files, 651 MB in all. Each row is a mesh point with its position, the water’s velocity and the pressure. The files went to Kaggle for training.
| Point ID | Points_0 | Points_1 | Points_2 | U.water_0 | U.water_1 | U.water_2 | |U| | p | p_rgh |
|---|---|---|---|---|---|---|---|---|---|
| 112898 | -0.001866 | 0.456234 | 0.100000 | -0.015046 | 0.143468 | 0.326067 | 0.356552 | 103556.0 | 104534.5 |
| 112899 | 0.000000 | 0.456222 | 0.100000 | 0.000000 | 0.161616 | 0.311972 | 0.351349 | 103556.5 | 104535.0 |
| 112900 | 0.001866 | 0.456234 | 0.100000 | 0.015047 | 0.143467 | 0.326067 | 0.356551 | 103556.0 | 104534.5 |
| 112909 | -0.001885 | 0.458115 | 0.100000 | -0.019699 | 0.118715 | 0.308863 | 0.331478 | 103558.0 | 104536.5 |
| 112910 | 0.000000 | 0.458109 | 0.100000 | 0.000000 | 0.133207 | 0.298873 | 0.327214 | 103558.5 | 104537.0 |
| … 135,725 more rows in this file, and 40 more files | |||||||||
Five rows from t1.55.csv, on the 1D-after plane. Positions in metres, velocity in m/s, pressure in Pa. The same files build every flow figure on this page.
Train and test
The model trains on every saved step up to 1.5 s and predicts the next ten, from 1.55 to 2.0 s. Most of the change in the flow happens before 1.4 s, so the test window is the flow settling into its final state.
Peak |U| on each sample plane at every saved step. The 1D-after plane speeds up as the jet along the outer wall forms. The 5D plane overshoots near 0.8 s before settling.
Features
One model per velocity component. To predict Ux at a point, the model gets Uy and Uz at that time and Ux at the three steps before. The water’s volume fraction can be added as an optional feature.
Real values in m/s from one mesh point on each sample plane, 7.4 mm off the symmetry plane. Each row is one training example.
XGBoost
XGBoost builds an ensemble of small decision trees. Each new tree fits what the trees before it got wrong, and its output is added with a small weight.
A gradient-boosted model fitted live in your browser to one real profile, 1D after the bend at t = 1.55 s: depth-2 trees, learning rate 0.3. The thesis models work the same way on many more features and points.
Strong results on tabular regression with little tuning.
Trees capture sharp changes, like the jump at the edge of the slow region.
Penalties on tree size and leaf weights hold back overfitting.
Shows which inputs the predictions lean on.
Trains on millions of rows on a laptop or a Kaggle notebook.
Copes with sparse and unscaled inputs.
Learning rate, tree depth and the number of trees were chosen by grid search, with an 80/20 train–validation split and cross-validation. Scored with mean squared error, mean absolute error and R².
Results
How close the predictions came, and how fast.
Size predictions
The first model predicted the volumetric density in each size class over time, on each sample plane. Before the bend the two curves overlap. Further downstream the model overshoots the peak, and the error grows.
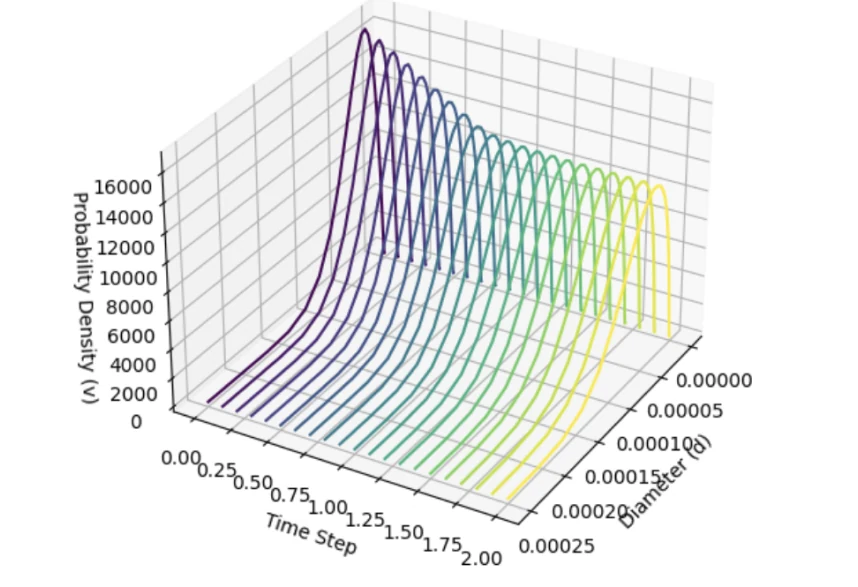
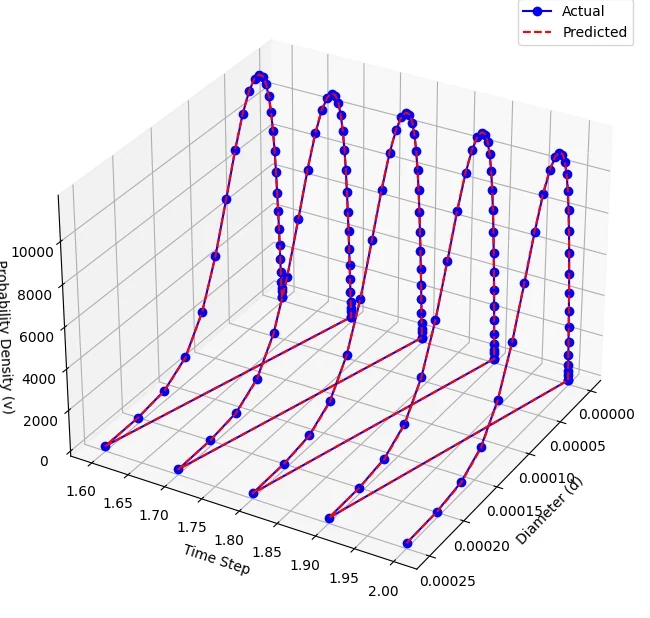
Fig. 4.2 and 4.3 from the thesis.
Mean squared error by plane
Table 4.1. Log scale: each grid step is ten times the last. Error rises about 400 times from before the bend to nine diameters after it.
Velocity predictions
The second model predicted the water’s velocity at every point on the sample planes. At 1.55 and 1.60 s the predicted fields keep the shapes of the CFD result, including the slow region on the inner wall after the bend.
Both fields are read back from the colours of the thesis figures. Checked against the CFD export, the decoded CFD fields are within 0.003 m/s on average, so the gap shown here is the model’s. The bands in the gap view are the contour levels of the original plots.
Accuracy
Errors per velocity component, over all test points. Uz, the flow direction up the vertical leg, has the largest: a mean absolute error of 0.054 m/s, about a tenth of the inlet speed.
Mean squared error
Mean absolute error
Table 4.2. MSE in m²/s², MAE in m/s.
Speed
Once trained, the model produced its predictions with about 20 times less compute time than the solver run it stands in for.
The same job, drawn to the thesis’ 20× figure: each bar fills in the time its method takes.
Next steps
What the thesis left for later.
Build the governing equations into the model, so predictions respect mass and momentum and hold up on new flow conditions.
Let the model explore a design space quickly, or give the solver a starting guess, and keep the solver for the final answer.
Fast predictions could feed flow control, monitoring and predictive maintenance in plants.
The same method applies to branching pipes, porous media and fluidised beds.
Report how confident each prediction is, which matters where a wrong answer is costly.
This thesis is where I first ran into how hard OpenFOAM is to set up. A few years later I built OpenFOAM Studio, a desktop app that writes and runs OpenFOAM cases from plain English.
OpenFOAM Studio →References
- Dutta, Saha, Nandi and Pal. Numerical study on flow separation in 90° pipe bend under high Reynolds number by k-ε modelling. Engineering Science and Technology, 2016.
- Kim, Yadav and Kim. Characteristics of secondary flow induced by 90-degree elbow in turbulent pipe flow. Engineering Applications of CFD, 2014.
- Xu et al. Bent pipe flow reconstruction based on improved ultrasound Doppler velocimetry and radial basis function neural network. Flow Measurement and Instrumentation, 2023.
- Cao, Xu and Jiang. Physics-informed machine learning based RANS turbulence modeling of convection heat transfer of supercritical pressure fluid. Int. J. Heat and Mass Transfer, 2023.
- Duraisamy. Perspectives on machine learning-augmented Reynolds-averaged and large eddy simulation models of turbulence. Physical Review Fluids, 2021.
- Font, Weymouth, Nguyen and Tutty. Deep learning of the spanwise-averaged Navier–Stokes equations. Journal of Computational Physics, 2021.
- Sharma, Chung, Akoush and Ihme. A review of physics-informed machine learning in fluid mechanics, 2023.
- Wang, Ding and Shao. The improved radial basis function neural network and its application. Artificial Life and Robotics, 1998.